
Python is designed to accelerate software development. It allows you to build your dream project swiftly. Mostly you will get enough performance from Python, however, you can expect a decent amount of decrease in performance when your project gets larger and complicated. Therefore, you will probably encounter scaling problems and large costs at some point. It’s okay though. After you manage to complete your project, you can start to apply optimizations.
Optimizations in a Python codebase can be applied relatively easier than other programming languages. In short, you can write code and optimize that code rapidly with Python. Firstly, you need to understand which parts of your code need to be optimized, whether an aspect of execution times or usage of system resources. You can improve your code quality by optimizing your code.
Let’s go through some examples of profiling Python code.
TL;DR
- Profile execution times with cProfile and timeit.
- Profile memory usage with memory_profiler and guppy3.
- Use Scalene, a full-featured profiler.
- Know your Data Types
- Avoid Premature Optimization
1. Profiling Execution Times
You know that there is always more than one way to implement an idea, an algorithm, or a solution, you name it. And you may be stuck thinking which method would be better to implement in the aspect of performance. Or you might be indecisive about which library to use amongst countless numbers of others. cProfile and timeit modules are here to save you from your endless thoughts and hesitations.
You can profile every part of your code, from simple functions to whole modules.
A simple comparison of two built-in functions.
|
|
Both functions call their own square root functions 10**5 (10000) times with BIG_NUMBER given. The results are (ran on Python 3.8.5):
| Function | Execution Time |
|---|---|
fast_function |
0.017s |
slow_function |
0.283s |
As you can see from the results, using n**.5 rather than sqrt(n) will result in faster code.
Important note: This was just a random example. Please see ‘Pitfalls’ section below before making this kind of optimizations.
Profiling a script (example.py)
|
|
Run in terminal:
|
|
Yes, that command yields a bunch of lines of data. Instead, you can use the timeit module to get plainer and comprehensible stats.
|
|
Quick note: the last two comparisons can return different results because we profiled a whole script at first, imports were included in the profile, and Python has a quite considerable amount of overhead for import. On the other hand, we just measured the time elapsed when processing the function get_word_count_of in the second profile.
So, these tools can give you insights on which parts of your code are working fast or slow and you can take an action depending on these insights. timeit and cProfile will meet your needs on profiling your code.
2. Profiling Memory Usage
Execution times put aside, memory usage is quite important too. You should track your memory usage (at least approximately) and perform heap analysis, so you can point out which parts of your code need to be optimized to get the most out of your available system resources. The more efficient usage of system resources, the more scalability and performance you’ll get.
There are two open-source tools that I can recommend:
- memory_profiler: For line-by-line profiling the memory usage.
- guppy3: For overall heap analysis.
It’s quite easy to use these tools, and there is enough guidance on their home page. Nevertheless, let’s go through some examples here as well.
memory_profiler has a decorator profile that monitors the wrapped function’s memory usage. You don’t need to change anything in your function. Just plug in the @profile expression on top of your function. As simple as that.
|
|
|
|
Filename: example_2.py

Line #    Mem usage    Increment  Occurences   Line Contents
============================================================
     3     18.6 MiB     18.6 MiB           1   @profile
     4                                         def wasteful_sum_function() -> int:
     5     19.1 MiB      0.5 MiB       10003       return sum([x**2 for x in range(10**4)])


Filename: example_2.py

Line #    Mem usage    Increment  Occurences   Line Contents
============================================================
     7     19.1 MiB     19.1 MiB           1   @profile
     8                                         def resource_efficient_sum_function() -> int:
     9     19.1 MiB      0.0 MiB       20003       return sum((x**2 for x in range(10**4)))
As you can see in the result, using Generator iterable instead of List iterable decreased our memory usage by .5MiB.
You can reach more detailed information on memory_profiler homepage.
3. Using Scalene as a Profiler
Scalene is a full-featured profiler written in Python, C++, and C which makes it really fast than other profilers.
Profiling with Scalene is as simple as;
|
|
Outputs as 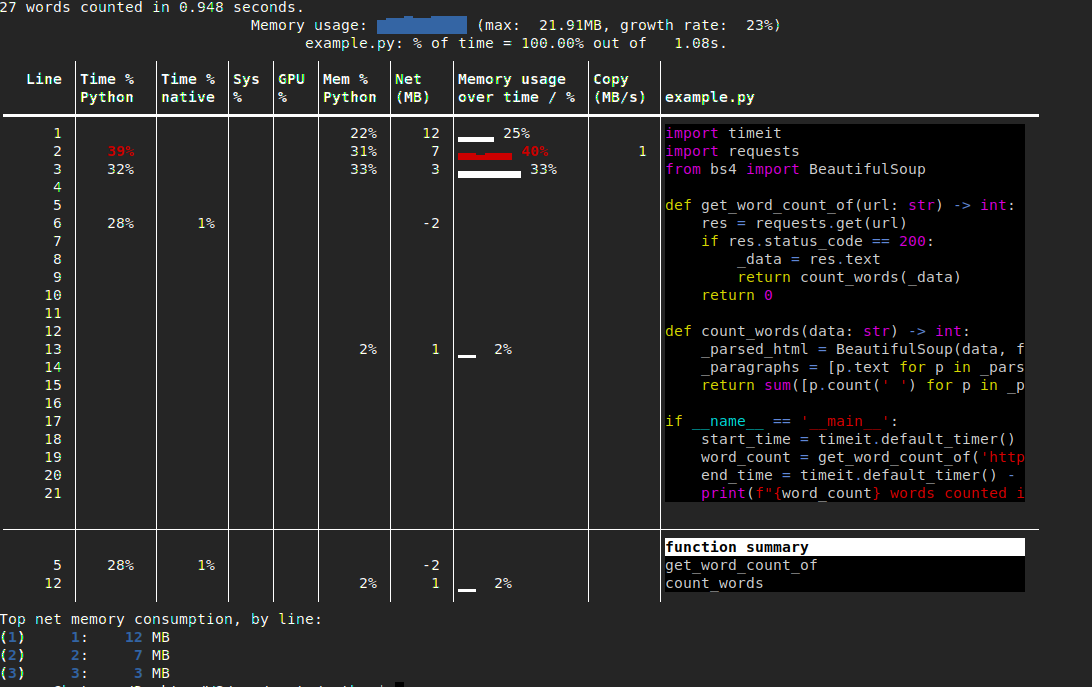
We can see which code blocks take most of the time elapsed (Time %), memory usage percentage and amount (Mem %, Net(MB)). These are quite important metrics, moreover, we knew the huge overhead of import in Python, and we’ve seen it again.
There are a bunch of options for scalene, e.g. --profile-all flag profiles the program in every aspect, CPU, GPU, Memory usage included.
You can check out man scalene or scalene github page for more detailed information.
Pitfalls
PLEASE keep in mind that
Premature optimization is the root of all evil.
Perfect is the enemy of good.
In other words, do not waste your time and energy with unnecessary optimizations which would not affect overall performance adequately. Otherwise, you’ll find yourself confused and lost, end up with a complicated and unreadable code. Just optimize inefficient code and avoid overdoing optimizations.
Conclusion
You can improve your overall performance by profiling and optimizing your code in different aspects. You can profile and compare functions and libraries all you want. But writing an efficient algorithm is the best way of optimizing. That is to say, write better code.
Closing tips:
- Use Python’s built-in functions as much as you can. They are quite fast, constantly getting better, and fit for almost every situation.
- Don’t overdo your optimizations. Instead, work on your real priorities.
- Write better algorithms. It’s the best way of optimization.
- Good is enough. You can just get close to perfect, you can’t reach it. Don’t bother.